How Better Reporting Helped Reduce Resolution Duration by 76%
Leading the Customer Services department at Perspectium, I value clear visibility into customer needs and into my staffing to meet those needs.
That desired visibility is common among customer-support directors. Their departments measure the capacity and the velocity of their organization, in order to answer questions, including . . .
- Am I properly staffed?
- Do I need supplemental training?
- What things do I need to address if we’re not meeting certain metrics?
There are some standard industry metrics that enable customer services to operate effectively. Key areas that I need to measure are incident response and resolution, along with engineer capacity and velocity.
I need to see the real-time status of those areas quickly and simply but with appropriate detail.
Integrating the ITSM Tool with a Database for Reporting
My support engineers work in ServiceNow. But the visual displays that I need call for advanced reporting.
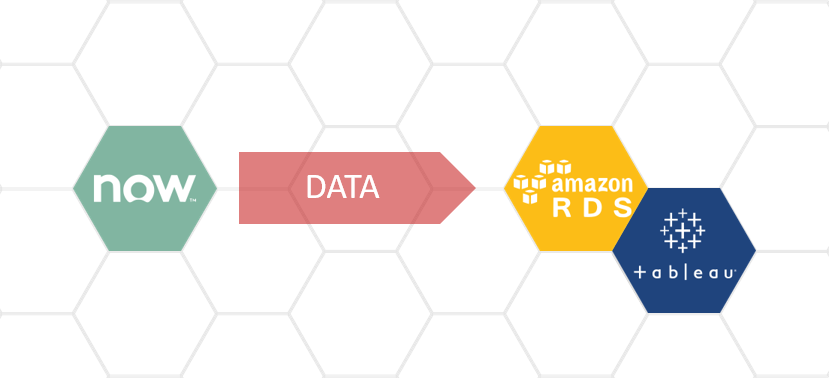
To address that challenge, our Customer Services department used DataSync to integrate ServiceNow with a database that we report from using Tableau.
A Visual Dashboard
I track for headcount planning. We typically have a certain number of tickets open per customer, per day. And I have a certain number of cases that can be handled and resolved per engineer, per day. After doing the math to get those in line, I can develop with my staffing plans.
A dashboard helps us to keep track of tickets, staffing, and so forth a lot better. And I can do it in real time, as opposed to needing to export data into spreadsheets, where charts would display obsolete data.
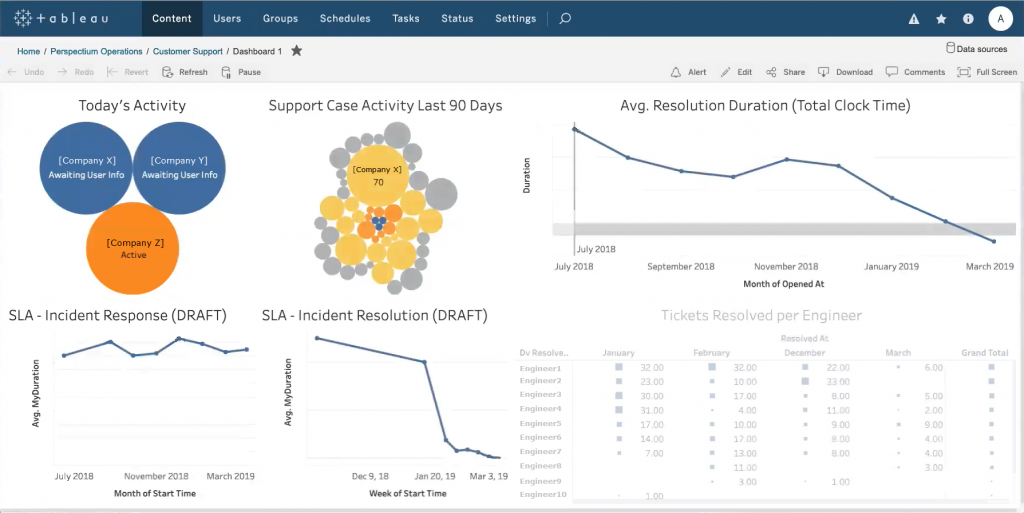
Some of the key metrics that I follow on a daily basis include
- Today’s activity
- Support case activity, last 90 days
- SLA incident response
- SLA incident resolution
- Average resolution duration
- Tickets resolved per engineer
Reducing the Resolution Duration by 76%
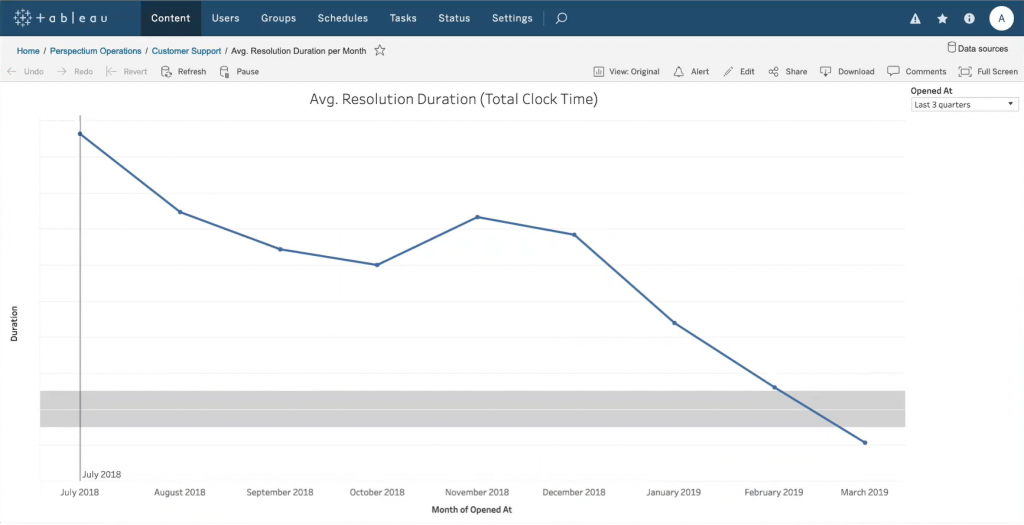
The incident resolution time has been decreasing, and a lot of that improvement has to do with this enhanced visibility. You can’t improve what you don’t measure. And after clearer measurement displays became available, our responsiveness improved. The total clock time reduced 76% from before we started measuring to afterward.
I measure the success of us as a support organization on our ability to resolve things within certain metrics that we’ve defined. This report and others like it have been a big part of understanding that ability.
With this report, I can assess the effectiveness of what I’ve put in place, evaluating whether it’s working or not—and adjusting accordingly.
Tracking SLA Achievement
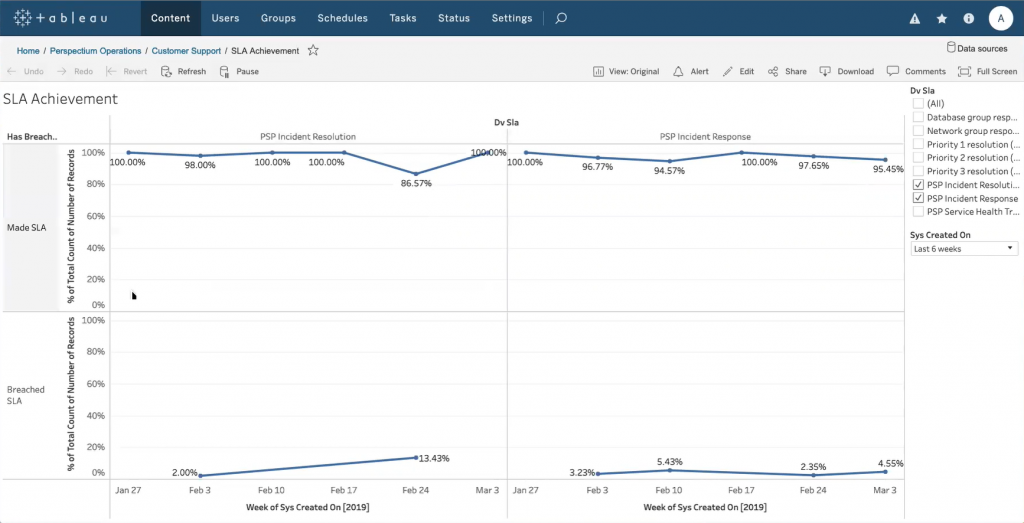
Another benefit of integrating our ServiceNow instance with a database for reporting is having the ability to display our SLA achievement. As with most service providers, we agree with customers that we will have a certain level of responsiveness.
This report on SLA achievement helps us see how we’re doing on our end of the agreement. Making sure that we’re achieving our SLAs is a key component to customer satisfaction.
Enabling Customer Success Staff
Another vital component for customer satisfaction is the work of our Customer Success managers. They stay in contact with customers, conducting periodic service reviews. During these reviews, they see how our customers are doing and discern additional ways that customers can raise the value they draw from Perspectium.
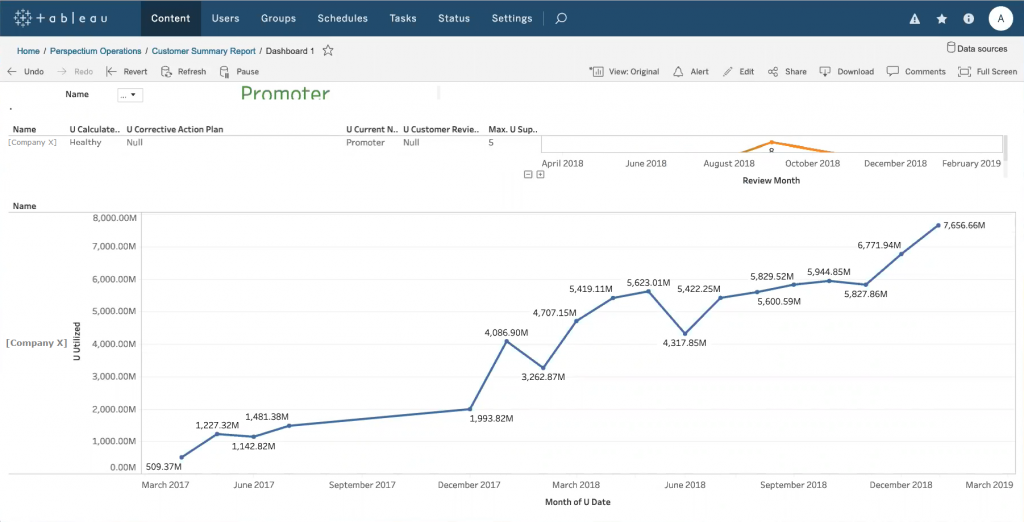
Because of our DataSync for ServiceNow integration for Tableau reporting, these Customer Success managers can see instantly what our customers are actually doing with their integrations.
Again, this is real-time data when we bring up this report. As soon as data is updated in ServiceNow, it gets replicated to our database that Tableau reports from.
We also have a consolidated Customer Success view. For a particular customer, we can see the current Net Promoter Score (NPS), whether the customer is a promoter, and the history of their health checks.
Right now, our Customer Success managers spend the better part of a day preparing for a customer review. We’re still building this report, but it will include incidents, our performance on support delivery, the past health trackers, data volume, and so forth. With this report, our Customer Success managers will save a great deal of time; they simply select a customer from a drop-down list to pull up key customer information instantly.
Clearer Visibility Leads to Better Customer Service
Our department sees a continuous flow of data and continuous interaction with our customers. We know—and the industry knows—that quick turnaround response and resolution times are key contributors to overall customer satisfaction.
If you’re responding quickly and resolving quickly, customers will be happier than if you’re not, even if the reported incident is not a big issue. Without quick response times, customers feel disenfranchised. But with quick response times, they feel heard and raise their satisfaction levels.
Are you interested in integrating for reporting in Tableau or another tool? Learn more about DataSync, which lets you integrate ServiceNow or Salesforce with a database for better reporting.
If you want access to some of the reports that Howie described in this post, we would love to share our Tableau definitions with you. Just click below to download.
NOTE:
- If using a Tableau version higher than 10.2, a pop-up will appear asking you to confirm upgrade to your current Tableau version. Click OK to accept this upgrade.
- These workbooks require you replicate the incident and task_sla tables.
- After entering your data source information, the dashboards will default to using a psp_repl database. If the incident and task_sla tables are located in a different database, you may be required to change it under the Data Source tab in Tableau.

